

Video Is on Demand!
4.16.20 | Deborah Platt
As we continue to track the COVID-19 pandemic’s effect on TV viewing, newly released data is providing further insight into the changes in viewing habits. Just two weeks ago, Ann’s blog post explored increased TV consumption with the onset of shelter-in-place orders in many parts of the country. At the time, Comscore had released preliminary data on over-the-top (OTT) usage and found that by mid-March usage was up by 25%. The last two weeks of the month saw steady growth, and Comscore reports that March ended in a 30% increase in OTT hours viewed over March of 2019 [1].
This post is going to dive further into the nuances of a category that falls under OTT, Video on Demand (VOD). Before we get too deep in alphabet soup, let’s clarify what exactly all of these acronyms mean. OTT is video streamed over the internet. It’s called “over-the-top” because it originally referred to going over or around cable and satellite to deliver video via the internet. VOD, or video on demand, is watching video at any time, whenever you want. OTT is inclusive of VOD but can also be streamed live. VOD is not live, but can also include video that is not OTT, think on-demand offerings from a cable provider.
Within VOD, there are even further subcategories. Subscription Video on Demand (SVOD) is inclusive of streaming providers that charge a recurring fee. Think Netflix, Amazon Prime, HBO, etc. where a monthly subscription provides unlimited streaming. Transactional on Demand (TOD) is a one-time fee to view content. Think of renting a movie through Comcast, Amazon, or DirecTV for a fee, and the video must be watched within a limited time period. Free on Demand (FOD) is the only ad-supported type of VOD. There is no fee or subscription to view video content; instead viewers are served advertisements. Examples of FOD providers are cable providers such as Comcast and Spectrum, networks such as NBC, CBS, FX, and AMC, and providers such as Hulu, YouTube and new-to-the-game Quibi.
Now that we’re clear on what this all means, let’s take a closer look on how VOD consumption has changed in the past month. According to Comscore’s measurement of all set-top box-based VOD, the average subscribing household is accessing, purchasing or renting 16 titles of VOD content over the course of the month; nearly four times more per household than March of 2019 [1]. Of the VOD subcategories, Subscription Video on Demand (SVOD) had the highest growth, with a 53% increase in average transactions per subscribing household from March 2019 vs. March 2020. Free on Demand (FOD) was next with a 21% increase for the same time period. Transactional on Demand (TOD) saw a 13% YOY increase.
Within the VOD categories “Fitness” increased 147%, “Life and Home” +64%, “Premium” +54% (i.e. HBO, Showtime, Starz). “Music” is down 10% March YOY.

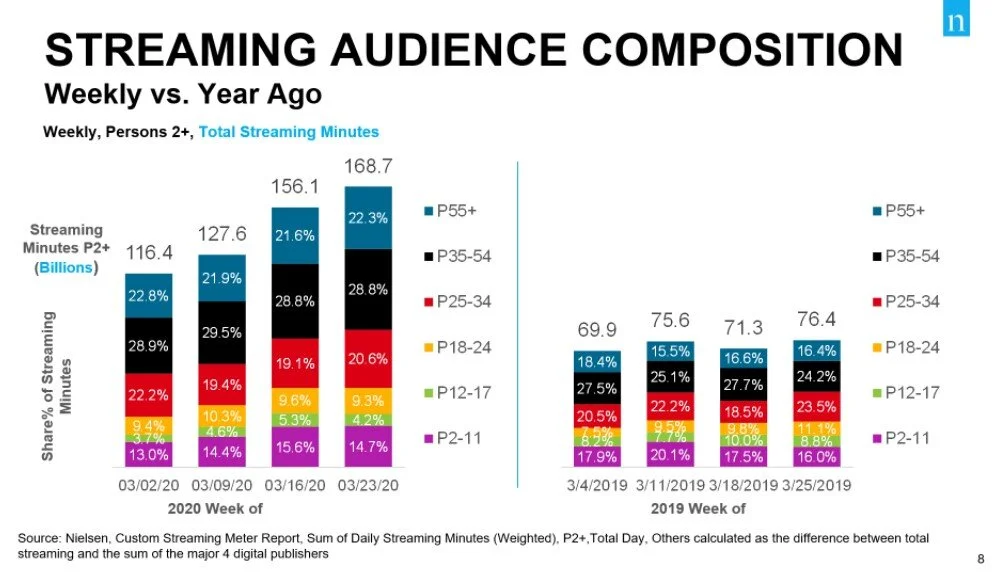
Nielsen, which does not include set-top box data but instead uses their streaming meter installed in 1,100 homes nationwide that have streaming capabilities has also measured this increase in VOD and SVOD. 88% of all homes now have the ability to access streaming video. Currently, Nielsen only provides data on TV use and not mobile or desktop due to privacy concerns.

Additionally, Nielsen’s data includes demographic breakdowns. The fastest growing population is 55+ and 35+ had the greatest increase.
In addition to the obvious cause for the spike in viewership – people are stuck at home – several contributing factors have accelerated the growth in VOD:
No live sports
Movie studios shift what would have been in-theatre movie runs to VOD
Reinventing traditionally live programs such as Saturday Night Live and The Late Show with Jimmy Fallon
Release of new programs such as Tiger King and Ozark on Netflix, Hunters on Amazon Prime
As media planners and buyers, we are tracking the changes in VOD viewing carefully. While consumption steadily rose in March, we’ll be keeping an eye on trends in April and whether we see some wear out. We’ll be evaluating the impact of these short-term changes on future consumption patterns. Specifically, will the increased adoption of VOD by the 35+ demographic having staying power? Will the ad-supported VOD and OTT landscape change dramatically? Stay tuned!
Sources
[1] https://www.comscore.com/Insights/Blog/Video-on-Demand-Transactions-Increase-in-Month-of-March
[2] https://answers.nielsen.com/portal/workspace/US+Media+Client+Communications/US+TV+Client+Communications/2020+Client+Communications/COVID-19+Insights/COVID+Streaming+Update+for+Agencies+-+For+Email+Distribution.pdf